

January proved to be a bumpy ride for investors, with stocks ending higher to begin the new year, despite concerns that the economy may be headed toward a significant slowdown or recession. Nevertheless, each benchmark index listed below posted solid gains in January, led by the Nasdaq (1), as tech stocks rebounded from a rough 2022. Stocks began the month by climbing higher in the first two weeks of January. However, equities lagged mid-month, only to rebound at the end of January and close out the month positively.
Recent economic data indicated that inflation may have peaked. The consumer price index and the personal consumption expenditures price index for December revealed a drop in the annual rate of price increases. However, the Federal Reserve and most central banks continued to stress further tightening. Fourth-quarter gross domestic product increased by 2.9%, a slower pace of growth than in the third quarter. For 2022, GDP increased by 2.1%. Several of the world’s leading economic indicators slowed in the second half of 2022, curtailing momentum into 2023.
February 1, the Federal Reserve raised the Federal Funds rate by .25%, as widely expected. During the post-meeting news conference, Fed Chairman Jerome Powell acknowledged progress in the fight against inflation, saying, “Inflation data received over the past three months show a welcome reduction in the monthly pace of increases”. However, he did not want the markets to get too giddy about the potential for a change in monetary policy that has seen the fastest rate increases in history. Powell added, “And while recent developments are encouraging, we will need substantially more evidence to be confident that inflation is on a sustained downward path”. “We can now say, I think, for the first time that the disinflationary process has started,” Powell said, while also noting that it would be “very premature to declare victory or to think we really got this.”
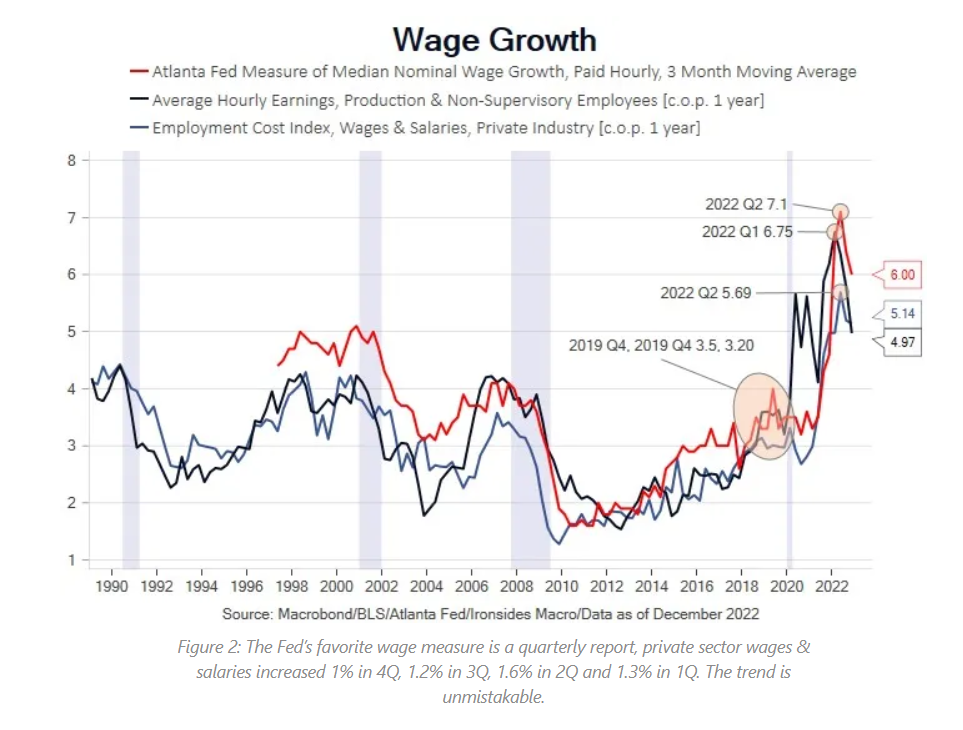
Reviewing the transcript of Powell’s post-announcement presser, more evidence apparently needs to come from the labor markets. “Despite the slowdown in growth, the labor market remains extremely tight, with the unemployment rate at a 50-year low, job vacancies still very high, and wage growth elevated. Job gains have been robust, with employment rising by an average of 247,000 jobs per month over the last three months. Although the pace of job gains has slowed over the past year, and nominal wage growth has shown some signs of easing, the labor market continues to be out of balance. Labor demand substantially exceeds the supply of available workers, and the labor force participation rate has changed little from a year ago … If you look across the rest of the labor market, you still see very high payroll job creation. And, you know, quits are still at an elevated level — by many, many indicators, the job market is still very strong.”
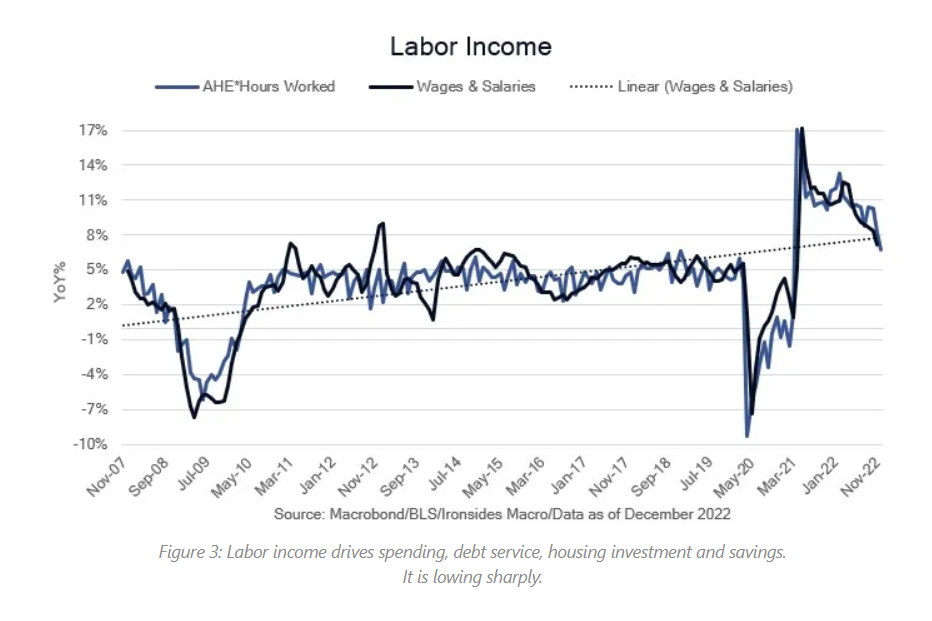
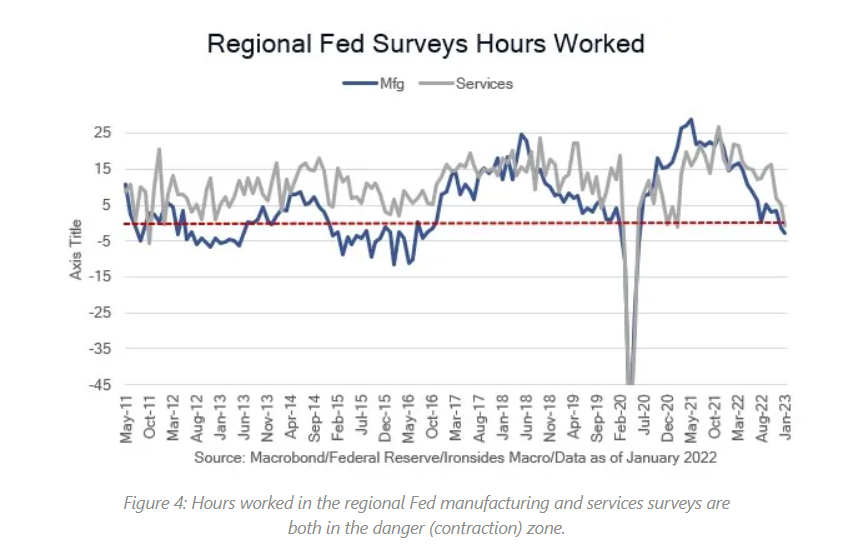
Barry Knapp of Ironsides Macroeconomics provided 3 graphs that show that more evidence of softening job markets is in the works considering trends in wage growth, labor income, and hours worked. If the Fed gets the evidence they need to pause policy, the economy may get a soft landing or even a touch-and-go!
Manufacturing activity decelerated, with industrial production falling over the past several months. Durable goods orders rose in December, driven largely by a jump in transportation. Excluding transportation, durable goods orders decreased 0.1%. The purchasing managers’ index declined as output levels fell amid weak customer demand. High interest rates and economic uncertainty led to reduced customer spending.
Fourth-quarter corporate earnings were generally favorable, however not as strong as the same period last year. Of the roughly 100 S&P (1) companies that have reported Q4 results, total earnings are down about 6.0% compared to a year ago and are expected by be down 7.2% overall.
Bond prices rose in January, pulling yields lower. Ten-year Treasury yields fell 32 basis points. The Treasury yield curve remains inverted, with the yield on the one-month bond at about 4.53%, while the 10-year bond yield sits at 3.52%. An inverted yield curve is often seen as an indicator of economic weakness. The dollar slid lower against a basket of world currencies. Gold prices rose nearly $114.00 per ounce in January, advancing for the second consecutive month.
Crude oil prices declined in January for the third straight month. Prices for U.S. and global crude oil notched their largest monthly decreases since November 2022. Oil prices were volatile in January, opening the month lower, but rising on optimism of China’s increased demand. However, prices slipped lower toward the end of January as overall demand appeared to wane. The retail price of regular gasoline was $3.489 per gallon on January 30, $0.398 more than December’s price, and $0.121 higher than a year ago.
Stock Market Indexes
| Market/Index | 2022 Close | Prior Month | As of January 31 | Monthly Change | YTD Change |
| DJIA (2) | 33,147.25 | 33,147.25 | 34,086.04 | 2.83% | 2.83% |
| Nasdaq (3) | 10,466.48 | 10,466.48 | 11,584.55 | 10.68% | 10.68% |
| S&P 500 (1) | 3,839.50 | 3,839.50 | 4,076.60 | 6.18% | 6.18% |
| Russell 2000 (4) | 1,761.25 | 1,761.25 | 1,931.94 | 9.69% | 9.69% |
| Global Dow | 3,702.71 | 3,702.71 | 3,990.37 | 7.77% | 7.77% |
| Fed. Funds target rate | 4.25%-4.50% | 4.25%-4.50% | 4.25%-4.50% | 0 bps | 0 bps |
| 10-year Treasuries | 3.87% | 3.87% | 3.52% | -35 bps | -35 bps |
| US Dollar-DXY | 103.48 | 103.48 | 102.08 | -1.35% | -1.35% |
| Crude Oil-CL=F | $80.41 | $80.41 | $79.08 | -1.65% | -1.65% |
| Gold-GC=F | $1,829.70 | $1,829.70 | $1,944.00 | 6.25% | 6.25% |
The theme of 2023 is adapting to an economic environment of peak inflation, peak Fed hawkishness, peak dollar, and peak interest rates. Though slowing a bit, the labor market and consumer marches on. The Fed’s hawkish posture, rooted in tamping inflation expectations, has many market participants convinced that the Fed will continue to raise rates until they see compelling evidence of a slowing labor market, which creates a “good news is bad news” dynamic. Despite lower inflation readings, stronger GDP growth, and labor market data suggest the slowing economy has yet to impact employment. One would think that lower inflation, with economic growth and a solid job market, would be good news; however, equity investors can sometimes interpret that as a reason for the Fed to continue tightening monetary policy, which may ultimately result in a recession. It is interesting to note that in 2023, the Federal Reserve’s rate-setting committee members will be refreshed, with the incoming members being decidedly more dovish than the exiting members. This may accelerate a pivot in Federal Reserve policy, especially if inflation readings continue to cool and the labor market shows signs of softening.
Our 2023 strategic allocation continues to be slightly overweight stocks, but with bond yields more appealing, we are adding back to bonds by reducing allocations to bond alternatives. We continue to up weight favorably valued cyclical sectors, including financials, industrials, materials, and energy. Healthcare, although a growth category, is also upweighted due to its favorable valuations and potential for gains in productivity through the adoption of technology. We are underweighting all other sectors.
We are long-term investors that believe in strategic diversification, keeping expenses down, and being tax aware in our investment decisions. We also believe we can add value to portfolio performance by adapting to changing macroeconomic conditions leaning into areas of perceived opportunity, and by managing risk by underweighting sectors with high valuations and challenged macroeconomic outlooks. These decisions are informed by our view as to the phase of the economic cycle and where favorable valuations can limit downside risk while providing upside opportunity. These views inform our allocation decisions and selection of the appropriate investment vehicles that express our core investment values and assessment of the current economic conditions.
The first quarter is always a good time to review your financial plan and investment portfolio as we head into tax season. Your January portfolio reports have been deposited into your eMoney vault, and we are available if you would like to schedule a review.
Thank you for the trust you place in us. We look forward to connecting soon!
Tim
- NASDAQ – The NASDAQ is an unmanaged group of securities considered to be representative of the stock market in general.
- S&P 500 Index – The Standard & Poor’s 500 (S&P 500) is an unmanaged group of securities considered to be representative of the stock market in general.
- Dow – The Dow Jones Industrial Average (DJIA) is an unmanaged group of securities considered to be representative of the stock market in general.
- Russell 2000 – The NASDAQ is an unmanaged group of securities considered to be representative of the stock market in general.
This material contains an assessment of the market and economic environment at a specific point in time and is not intended to be a forecast of future events or a guarantee of future results. Forward-looking statements are subject to certain risks and uncertainties. Actual results, performance, or achievements may differ materially from those expressed or implied. Information is based on data gathered from what we believe are reliable sources.
The opinions expressed in this commentary are those of the author and may not necessarily reflect those held by Kestra Investment Services, LLC or Kestra Advisory Services, LLC. This is for general information only and is not intended to provide specific investment advice or recommendations for any individual. It is suggested that you consult your financial professional, attorney, or tax advisor with regard to your individual situation. Comments concerning the past performance are not intended to be forward-looking and should not be viewed as an indication of future results.
Converting a traditional IRA to a Roth IRA is a taxable event and could result in additional impacts to your personal tax situation, including the taxation of current social security benefit payments. Be sure to consult with a qualified tax advisor before making any decisions regarding your IRA.