

The debt ceiling “crisis” generated significant market angst amongst the public… yet again. It’s a political game of chicken where both sides assure the public, that they will not permit the government to default. However, the process is difficult to watch, as each side must negotiate with the other and wrangle the factions within their party to craft a bill that will pass both houses and be signed by the president. It reminds me of local news channels’ weather reporters when a bad storm blows into town, and they interrupt a Cowboys game. It’s their moment in the limelight. The storm passes, and it is back to business as usual. Market focus is now shifting back to the state of the economy and Fed policy.
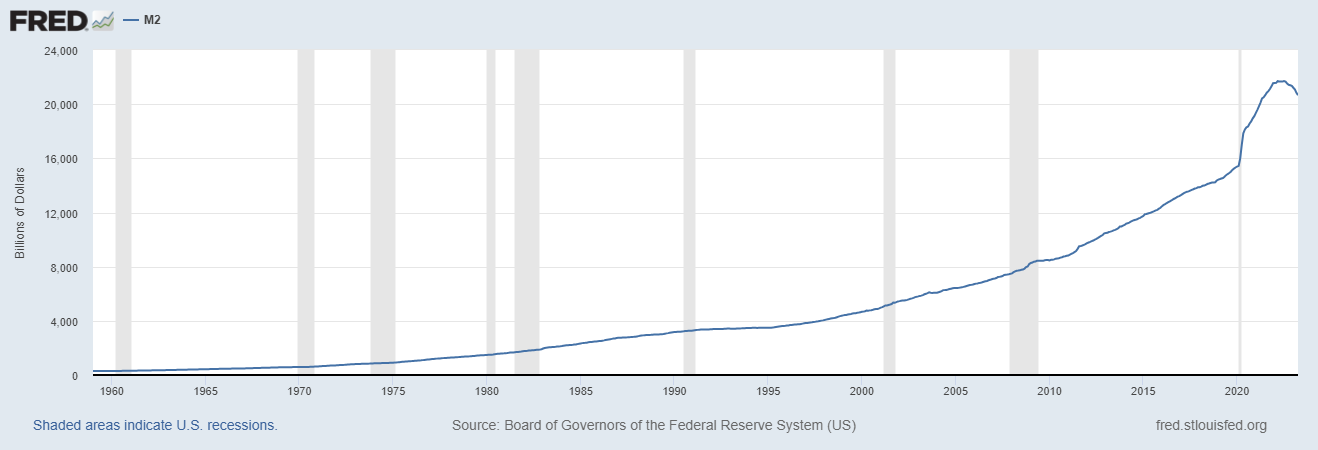
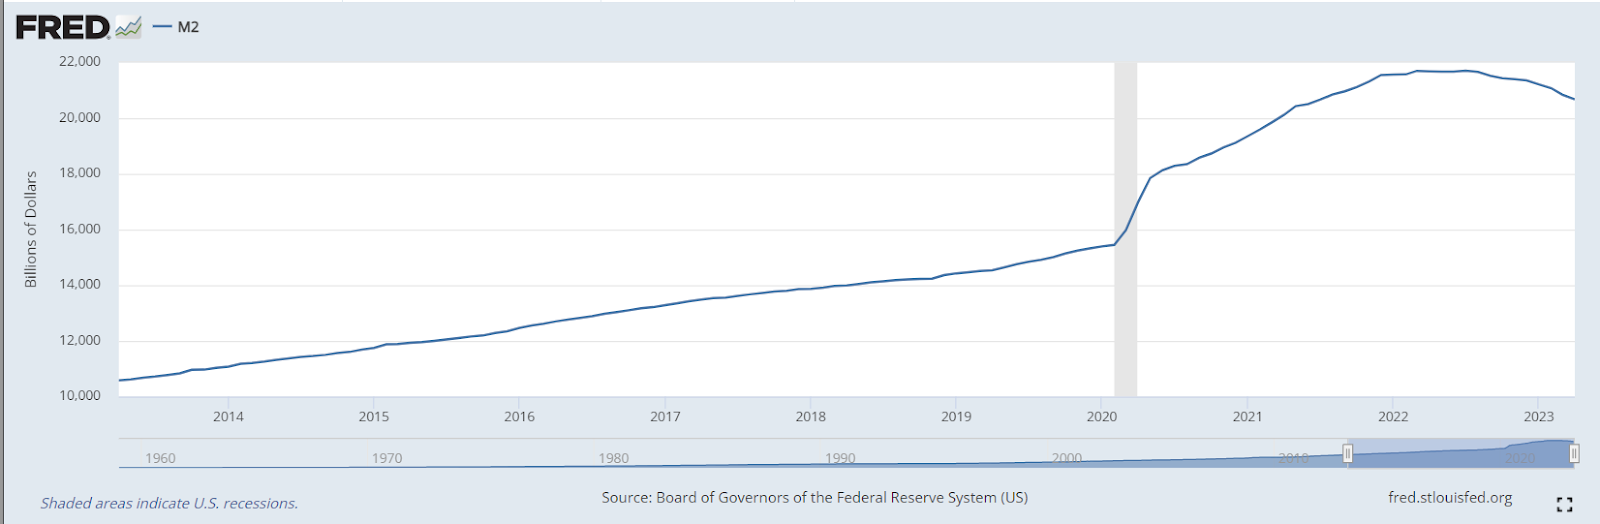
Though the Federal Reserve appears near the end of this tightening cycle, which should be good news for stocks, the markets must digest the treasury issuing more bonds to replenish the Treasury’s General Account (TGA). The TGA is essentially the federal government’s checking account from which it pays bills, and they have a lot of bills to pay! The amount of treasury bond issuance is significant, and more supply of bonds generally lowers prices paid for bonds and increases yields. Issuance also withdraws liquidity from the economy, a continuance of the headwinds longer-dated risk assets (stocks & bonds) have faced throughout the federal reserve’s tightening cycle that began in early 2022. The M2 money supply graphs below illustrate the primary money supply measure through April 2023.
M2 money supply refers to the broad measure of money, including physical currency, checking accounts, savings accounts, and certain types of money market accounts. The graph starting in 1960 sets the historical context of just how significant the monetary policy moves were in response to the pandemic. It is also important to note how the M2 curve has rolled over since early 2022. Note the hook downward in M2 beginning in 2022; not only has this pandemic era been the most significant injection of money supply, but the post-pandemic era will also be the most significant reduction in the money supply. Here’s Wharton Finance Professor and Economist Jeremy Siegel’s observation from last week, “Money supply is still plunging. Nine consecutive months of decreases in the money supply should be concerning the Fed. Some of that is clearly deposits leaving banks to higher-yielding Treasury alternatives that are not in M2 and are not as liquid.”
What Professor Siegel is referring to as “concerning the Fed” is a decrease in M2, which leads to a reduction in consumer spending and business investment that slows economic growth and can even lead to a recession. Slowing the economy is an intended outcome of the Federal Reserve’s current policy as it battles inflation; however, going too far can result in overly tight credit conditions, which is already underway as deposits have been leaving banks for higher yields. Banks will become more reluctant to lend and raise loan interest rates with less money available. If this dynamic goes too far too fast, it can lead to financial stability concerns and liquidity shortages, making it difficult for individuals and businesses to meet their short-term obligations. At the extreme, it can increase the risk of defaults and potentially trigger a financial crisis. The good news is that the Fed appears to be nearing the end of tightening, and if credit conditions deteriorate, the Fed has room to reverse policy.
The pandemic era has ushered in a sea change in economic dynamics. This historical period will mark a secular change from benign inflation and low-interest rates to higher inflation and interest rates. Investors need to heed this change by not being overly concentrated in any one type of investment and not assuming that investing will revert to how it was before the pandemic era.
So far in 2023, stock market performance has been driven by a few large growth technology stocks (see table from June 2, 2023, below). A common metaphor for this narrow market dynamic is that the generals are leading the charge, but the soldiers have fallen behind. The technical term is market breadth. Market technicians use breadth to assess the strength or weaknesses of stock market trends and gauge market sentiment. In layperson’s terms, if more stocks are going up than down, that’s a good sign for the market trend. If only a few stocks are rising as we’ve seen in this market and the balance of stocks languishes, that’s not a sign of a robust stock market trend. When the market has had a few big winners driving the overall market returns, technicians will suggest caution. Combining week breadth and the credit contraction concerns described above warrants caution.
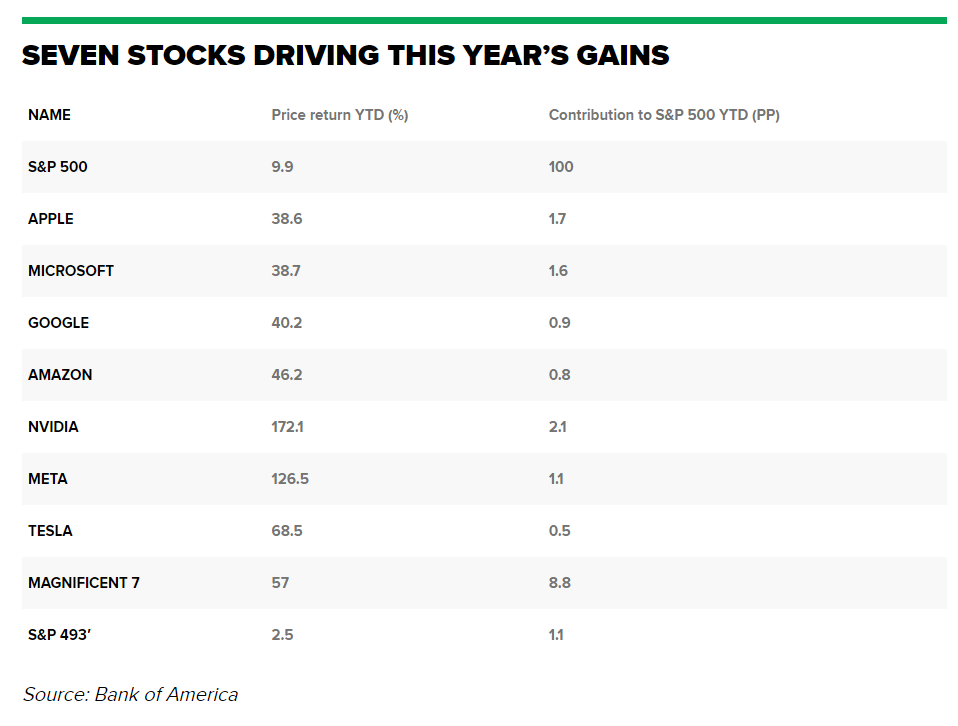
Source: Bank of America. June 2, 2023.
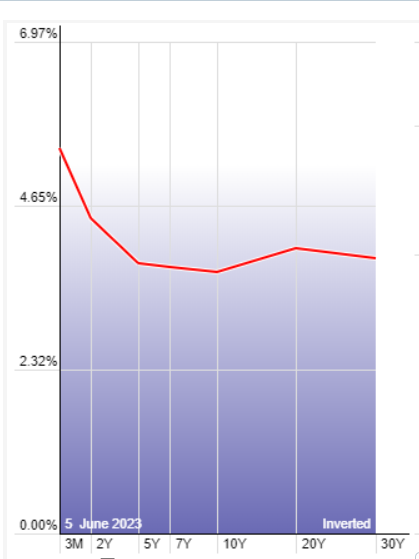
With the yield curve still deeply inverted, investors can continue to collect higher yields than they have seen for years in liquid money market funds. We are using these and U.S. floating rate treasury ETF to keep some funds on the sidelines to cushion volatility and as dry powder when more compelling opportunities present themselves. This is not to imply that we have drastically cut market exposure but rather that we are making incremental changes to the typical portfolio allocations. We will continue to stick to our long-term view and keep your investments diversified. Doing so lessens the chances that a drawdown in any one investment will do lasting damage to your portfolio.
Your May portfolio reports and account statements have been posted to your eMoney vault. We are here to help! If you would like to discuss the state of the economy and markets or review your financial plan and portfolio, I encourage you to schedule a virtual or in-person meeting.
Thank you for your continued trust!
Tim
___________________________________________________________________________________
This material contains an assessment of the market and economic environment at a specific point in time and is not intended to be a forecast of future events or a guarantee of future results. Forward-looking statements are subject to certain risks and uncertainties. Actual results, performance, or achievements may differ materially from those expressed or implied. Information is based on data gathered from what we believe are reliable sources.
The opinions expressed in this commentary are those of the author and may not necessarily reflect those held by Kestra Investment Services, LLC or Kestra Advisory Services, LLC. This is for general information only and is not intended to provide specific investment advice or recommendations for any individual. It is suggested that you consult your financial professional, attorney, or tax advisor with regard to your individual situation. Comments concerning the past performance are not intended to be forward-looking and should not be viewed as an indication of future results.