

Wall Street proved resilient during 2023’s first quarter, despite rising inflation, uncertainty about the Federal Reserve’s actions, interest-rate hikes, and banking concerns. The quarter began with stocks enjoying their best January performance since 2019 as investors saw a glimmer of hope that inflationary pressures were easing. Unfortunately, some of January’s gains were wiped out in February, and March proved to be volatile, with stocks riding a roller coaster for much of that period. Overall, equities closed the first quarter higher. The tech-heavy Nasdaq led the benchmark indexes (16.8%), followed by the S&P 500 (7.0%), the Global Dow (5.9%), the Russell 2000 (2.3%), and the Dow (0.4%). These results mirror the relative performance of the major indexes throughout 2022, with the tech-heavy NASDAQ being the distant third.
The Federal Reserve has not relinquished its leading role in the drama of all things normalizing or returning to trend in the post-pandemic era. After a difficult 2022, investor enthusiasm for a new year was sparked by indications from the Fed that they saw signs of deflation, but the optimism soon faded. In early February, hotter-than-expected employment and inflation reports dashed investor hopes that the Fed would soon curtail tightening. Much of the gains were given up by the end of February. In early March, news broke that two regional banks, Silicon Valley Bank (SVB) and Signature Bank, were in trouble.
Idiosyncratic or Systemic?
Initially, what troubled these financial institutions was chalked up to their unique customer bases (high-tech, venture capital, and crypto companies) that resided within sectors of the economy that suffered in 2022. Were they just unfortunate outliers from their more pedestrian regional bank contemporaries? Or were these lightning-fast, idiosyncratic bank failures just the tip of an iceberg? In the hours and days that ensued, it became apparent that federal policy response to the pandemic had inflicted a systemic risk upon the regional and smaller bank system.
The issues that brought down SVB and Signature Bank appear idiosyncratic and systemic. The distinctive nature of being the first to fail made them vulnerable and the first to surface. Their high-tech customers had a tough year in 2022. Rather than money flowing in, they drew their deposits out. Dwindling deposits meant the bank would have to sell investments they had intended to hold until maturity. The systemic risk arose because the banks purchased bonds when interest rates were at historic lows and needed to sell them after the Fed increased rates historically fast to fight inflation. Inept bank management, poor risk management, and a failure of regulatory oversight were all culprits contributing to these banks’ demise. But another element contributed to these bank failures within the banking industry’s balance sheets. A rapid rate increase drove down the value of the bond and mortgage investments comprising much of their capital base. Rather than bad loans and credit risk damaging the system’s financial stability in 2008 & 2009, the interest rate risk was forced into their balance sheets during the pandemic.
The government’s pandemic response was to essentially stop the economy to halt the spread of the virus. To prop up the economy, federal officials turned on the printing press. The Federal Reserve cut interest rates to near zero and became a whale buyer of treasury bonds and mortgages. Consumers stuck at home, received federal payments, and enhanced unemployment. Businesses got PPP loans and other emergency funding. Consumers and corporations deposited funds into the banks. Banks generate returns on the deposits they hold by either lending or investing. Customers were not borrowing while the economy was shut down, so banks invested in the securities they were permitted to hold under regulatory capital requirements. Interest rates were extremely low when money flowed into their depository accounts, and loan demand was near zero. Thus, they bought US treasury bonds and mortgages at meager yields.
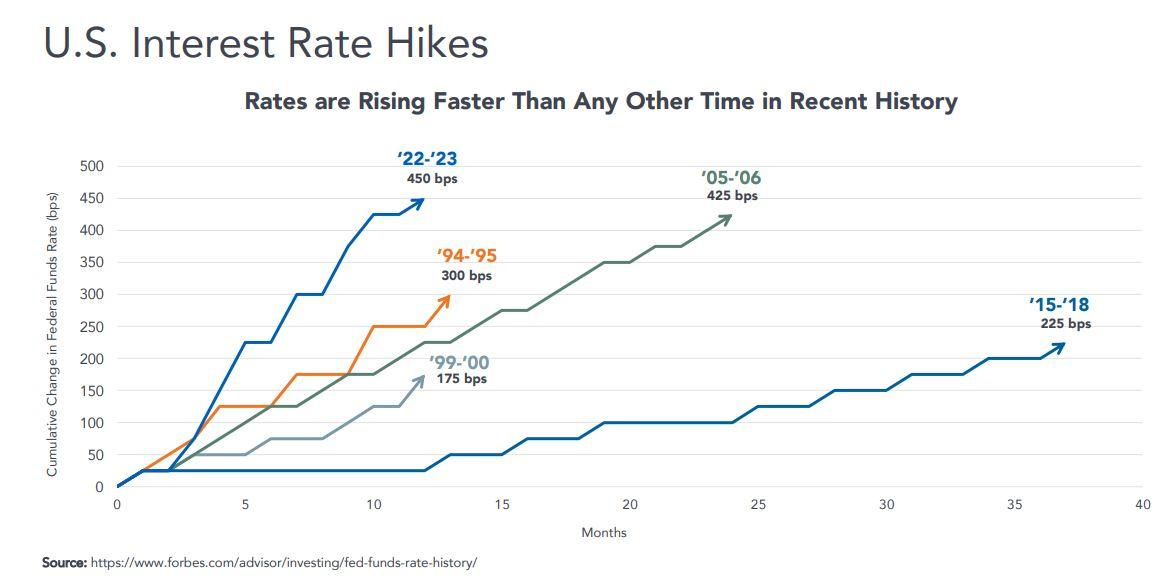
The supply shocks of the pandemic and the stimulated demand for easy money were very inflationary. Critics of the Federal Reserve, and there are many, say the Fed kept their easy, stimulative policies in place for far too long and recognized the inflation problem their policy created way too late. In 2022, the Fed raised rates at historically rapid and high incremental increases.
Deposit Flight: Fear and Greed
A bank run occurs when many customers withdraw their deposits simultaneously, usually due to a loss of confidence in the bank’s ability to repay their deposits. During a bank run, customers rush to withdraw their deposits, which can quickly deplete the bank’s cash reserves. If the bank cannot meet the demand for withdrawals, it may be forced to close its doors or declare bankruptcy. In the digital era, word got out fast via social media that SVB may be in trouble, and people signed onto banking apps to transfer funds. News broke that the bank was having problems Thursday afternoon, and by opening time on the following Monday, regulators had taken over the bank.
To prevent bank runs, the government offers FDIC insurance or provides emergency funding to banks in times of crisis. If depositors have concerns about their banks, it can ripple throughout the broader economy, leading to a loss of confidence in the banking system and a decrease in lending and economic activity. In this case, FDIC insurance was extended to all deposits beyond the usual FDIC limit. In addition, the Federal Reserve established a special facility to lend money on bank-held investments as if it is worth its maturity value, as opposed to its mark-to-market value. It was a fast and effective response to a situation that could have devolved into a much bigger issue had depositors of other institutions lost confidence in their banks. The fix appears to be holding. Bond yields have retreated in the past few weeks, alleviating pressure on bank balance sheets and public fear about the banking system’s stability.
Another reason deposits flow out of banks is significantly higher treasury bill and money market account rates. If you have cash sitting in a checking or savings account, you understand the FDIC insurance limit is $250K per account registration and recognize the interest you are paid on your balance. The FDIC monitors and reports those rates, and as of March 2023, the average Savings deposit yielded .37% and interest checking just .06%. Money market funds invest in very short-term and higher-quality instruments; current yields are over 4%, a significant incentive to move money out of bank accounts and into treasuries or money market funds.
Regional and community banks are responsible for nearly half of the business and consumer lending; losing deposits means tighter credit conditions. The dilemma regional and community banks find themselves in is due to the Fed’s faster raising of short-term rates to a greater magnitude in recent history to tame inflation. Still, it’s bitter medicine that darkens the outlook for economic vitality and the earnings capacity of the banking sector.
The good news is that the challenges banks face were caused mainly by the Federal Reserve’s policy and can be alleviated by the Federal Reserve’s policy. There are many signs the economy is slowing, which could give the Federal Reserve reason to pause or even lower rates. Doing so will improve banks’ financial positions by helping to recover the value of the bonds and mortgages banks hold. It may also reduce the difference between the yield banks pay depositors versus yields on treasury bills and money market funds.
Though recent events, specifically in the financial services sector, have increased the likelihood of a recession, we are still constructive on the longer-term outlook and believe investors that stay true to a diversified discipline will be rewarded with the highest real returns over and above inflation.
Our optimism is rooted in the fact that 2023 consumers and corporations are in pretty good shape. Consumers locked in low mortgage rates for their homes which have appreciated. Also, the labor market has remained robust and unemployment low. Debt service as a percentage of income is historically low. Corporations took advantage of the low rates and locked-in funding. The financial sector will face headwinds in terms of tighter credit conditions which will negatively impact earnings and profitability. If bank issues return, economic growth will suffer, and inflation will abate. However, today, the likelihood of a financial institution failure contagion appears to be contained.
Whether you are decades or years from retirement or already retired, we offer guidance and services to help you find financial peace and erase the anxiety about spending too much each year or investing appropriately. The past year has been a test for many, even those with significant savings. Concerns about rising inflation and nest eggs dented by the challenging market are normal; it’s part of being an investor. If you have concerns or are going through a transition or life change, I encourage you to take us up on our review offer or reach out to us to schedule a conversation. We are here to help!
Thank you for the trust and confidence you place in us!
Tim
Yield Curve Explainer
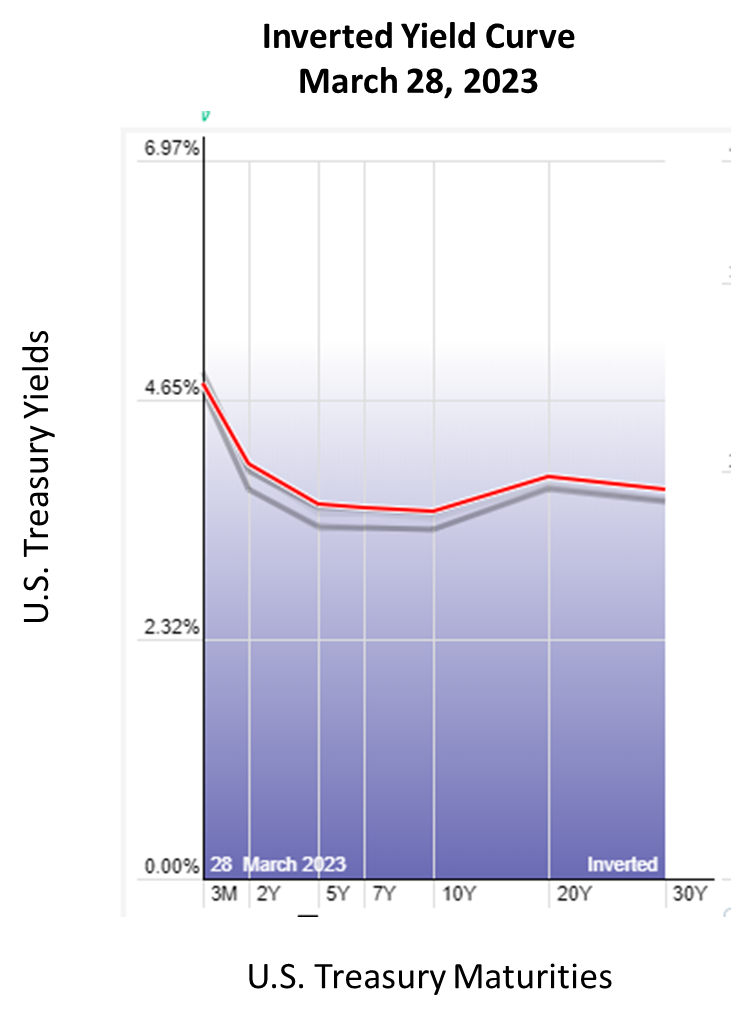
Federal Reserve’s policy centers primarily on manipulating interest rates. They assess the interest rate environment by looking at the yield curve. If you watch any financial news, you’ll often hear about an inverted yield curve signaling impending recession. The yield curve is also a snapshot in time when interest rates are the highest and lowest. For example, presently, the yield curve is very inverted, which explains the high short-term rates investors are enjoying on what’s considered safe money, such as treasury bills and money market funds. I offer this yield curve explainer if you want to learn more about how Federal Reserve policy impacts interest rates in our economy.
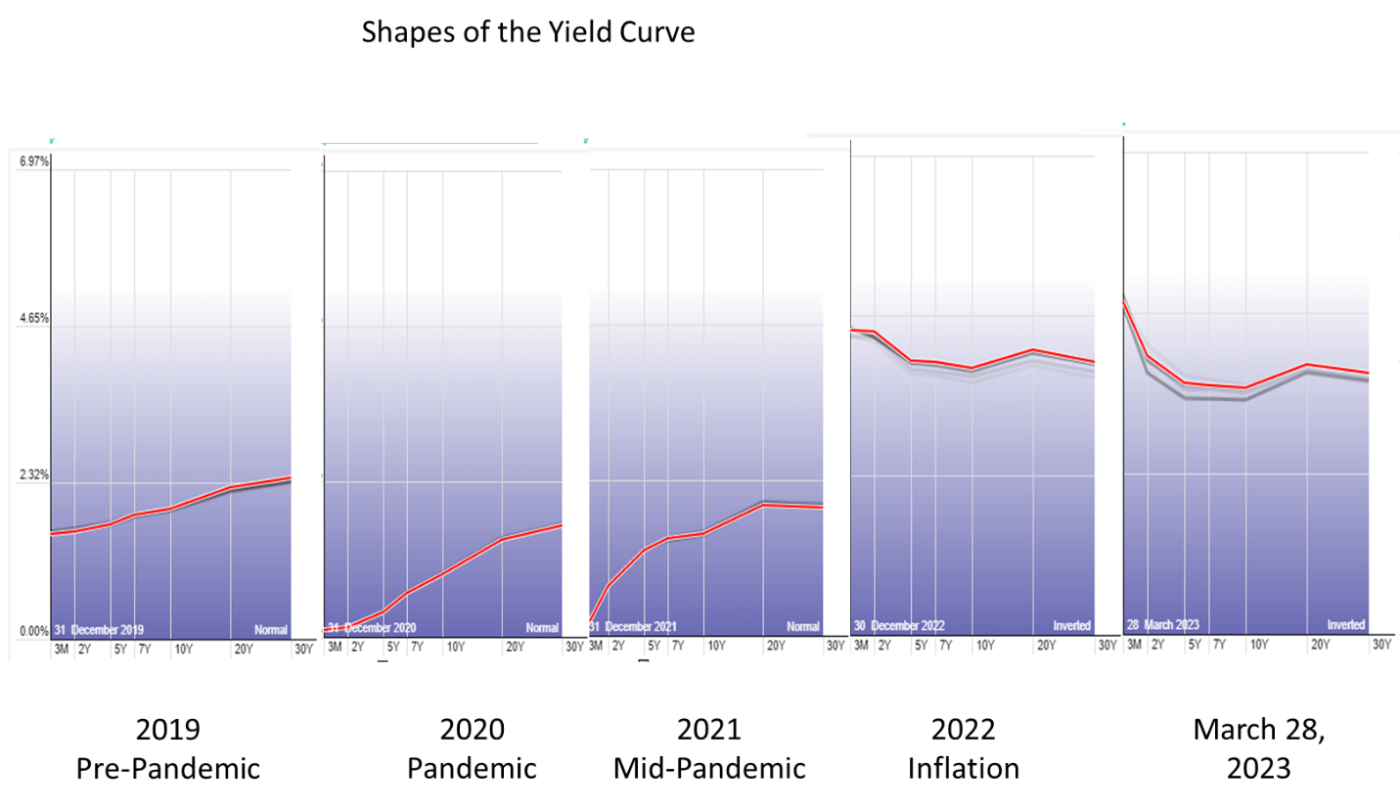
The yield curve plots the interest rates of bonds with different maturities on a graph; you can see how they vary over time. Generally, longer-term bonds have higher interest rates than shorter-term bonds because longer-term bonds are riskier for investors, as there is a greater chance that inflation or other economic factors will affect the value of the bond over a longer period. Investors demand higher interest rates for longer-term bonds to compensate for this added risk. We will call this a “Normal” yield curve, often seen as a sign of a healthy economy. Here’s what the yield curve looked like approximately 20 years
ago.
When short-term interest rates are higher than long-term rates, it is known as an inverted yield curve, which can signal an upcoming economic downturn. Below is a recent snapshot of the yield curve. Note how much higher yields are for short-term money.
To affect the shape of the yield curve, the Fed sets the federal funds rate, which is the interest rate that banks charge each other for overnight loans to meet reserve requirements. When the Fed raises the federal funds rate, it becomes more expensive for banks to borrow money, which can lead to an increase in the interest rates on all types of loans, including bonds. Rate policy primarily affects the short-term end of the yield curve.
Quantitative easing (QE) is a monetary policy tool the Fed uses to stimulate the economy by buying large quantities of government bonds and other securities. The Fed extensively used QE as part of its pandemic response. Quantitative tightening, also known as “QT,” refers to the Federal Reserve’s process of undoing the QE it did during an economic crisis. QE expands the Feds bond holdings. QT attempts to unwind those purchases (the size of its balance sheet) by selling assets or letting maturing bonds run off (not reinvest).
During quantitative easing, the Fed injected money into the economy by purchasing these securities, which increased the money supply and lowered interest rates. This maneuver helped to encourage borrowing and investing, which in turn boosted economic growth. However, as the economy has improved and inflation has risen, the Fed has started to worry about the potential for inflation to become too high. To counteract this, the Fed has begun to reduce its balance sheet through quantitative tightening. Quantitative tightening makes borrowing more expensive, which can slow down economic growth and help to prevent inflation from getting out of control. Quantitative policy primarily affects the longer end of the yield curve.
- NASDAQ – The NASDAQ is an unmanaged group of securities considered to be representative of the stock market in general.
- S&P 500 Index – The Standard & Poor’s 500 (S&P 500) is an unmanaged group of securities considered to be representative of the stock market in general.
- Global Dow – The Global Dow is an unmanaged group of securities considered to be representative of the stock market in general.
- Russell 2000 – The Russell 2000 is an unmanaged group of securities considered to be representative of the stock market in general.
- Dow – The Dow Jones Industrial Average (DJIA) is an unmanaged group of securities considered to be representative of the stock market in general.
This material contains an assessment of the market and economic environment at a specific point in time and is not intended to be a forecast of future events or a guarantee of future results. Forward-looking statements are subject to certain risks and uncertainties. Actual results, performance, or achievements may differ materially from those expressed or implied. Information is based on data gathered from what we believe are reliable sources.
The opinions expressed in this commentary are those of the author and may not necessarily reflect those held by Kestra Investment Services, LLC or Kestra Advisory Services, LLC. This is for general information only and is not intended to provide specific investment advice or recommendations for any individual. It is suggested that you consult your financial professional, attorney, or tax advisor with regard to your individual situation. Comments concerning the past performance are not intended to be forward-looking and should not be viewed as an indication of future results.