

As of mid-2023, we’ve seen a rebound in the equity markets. However, a narrow list of mega tech sector names propelled by recent artificial intelligence innovations has led to the rebound. Investors have piled into these names on the prospect of long-term growth and earnings. Conversely, what worked in 2022, dividend payers, companies with robust cash flows, and value stocks have lagged thus far in 2023.
Attached is the second quarter market review. Page 3 summarizes Q2 returns by asset class. U.S. stocks significantly led all other asset classes with large-cap growth (page 7), leading U.S. stocks and delivering over three times the return of large-cap value stocks. As we wrote last month, a few mega-tech stocks drove the bulk of overall equity performance. When only a few stocks lead and the majority lag, it raises a caution flag. However, with the Q2 earnings season underway, market breadth has improved (the percentage of stocks participating in the uptrend has broadened), which is an encouraging sign of the durability of the uptrend.
Though the year-to-date equity returns are encouraging, the economy and financial markets continue to grapple with the consequences of pandemic-era measures. The global economy is unlikely to fully revert to its pre-pandemic state due to factors like increased sovereign debt, permanent changes in trade dynamics, societal value system renegotiation, including the terms and exchange value of work for wages, and technological innovation continues to present the catalyst for, and the pace of, change. The past three years’ strains and extremes have complicated the job of central bankers. Like a cruise ship juggler performing in rolling seas, central bankers are navigating three conflicting objectives: full employment, a 2% inflation mandate, and a stable financial system.
Despite cooling inflation readings, the Federal Reserve continues to express its resolve to achieve its 2% inflation rate mandate. It is expected to increase the discount by another .25% at its upcoming July meeting. In addition, the U.S. Department of the Treasury is issuing bonds to replenish the treasury’s general account after the debt ceiling deal, further reducing liquidity by removing cash from circulation. Furthermore, the top Federal Reserve Regulator plans to increase capital requirements for the nation’s largest banks. All actions will remove liquidity from the economy and tighten credit conditions. At the very least, these policies will make the financial environment more challenging for banking institutions. The traditional earnings model of banks, which involves borrowing funds at shorter-term rates (collecting deposits) and lending them out at longer-term rates, is being hindered by a deeply inverted yield curve. Furthermore, bonds and mortgage securities purchased during the pandemic still impair banks’ balance sheets, with market values well beneath purchase prices.
The point is that credit conditions are tightening, which will likely further slow the economy and impede bank earnings. Should the Fed over-tighten, it could come at the expense of harming the labor market and destabilizing the financial system. With recent better-than-expected inflation readings, investor sentiment is more optimistic in anticipation of a soft landing. Still, the tension between the Federal Reserve’s attaining its inflation directive and causing adverse effects of higher unemployment, a credit crunch, or even instability in the financial system is a risk.
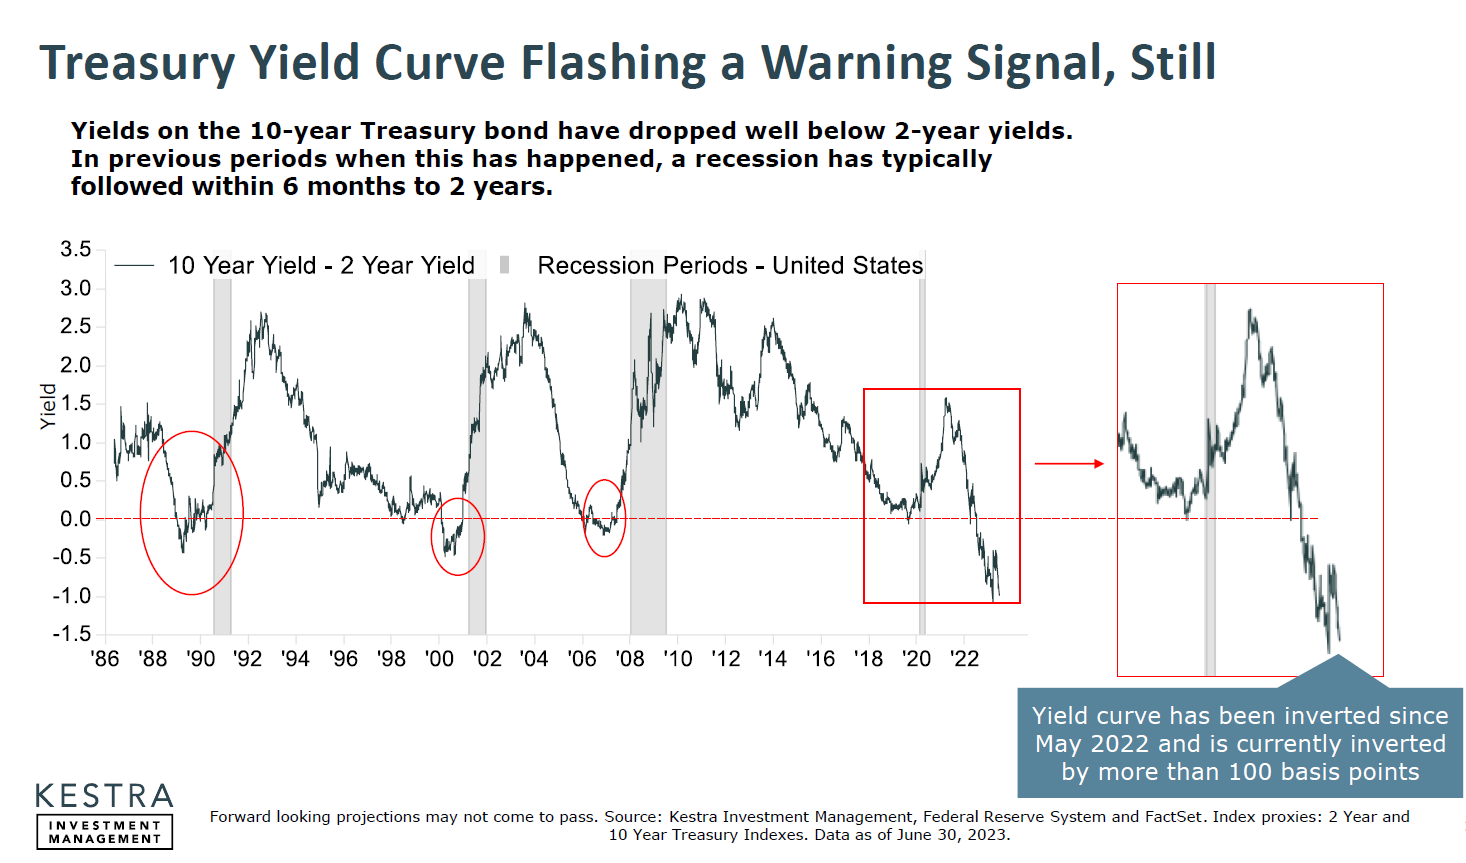
The inversion of the yield curve has been a long-accepted indicator of the risk of recession. It also measures how challenging the current interest rate environment is for banks. The graph below illustrates the relative depth and duration of the current yield curve inversion compared to prior episodes. Dismissing the warnings of the yield curve and the potential of a credit crunch or even further bank insolvencies as those experienced just a few short months ago is foolhardy.
The best advice for investors is to stay disciplined in their investment strategy and continue to lean into opportunities and away from likely risk. Yields on bonds, CDs, and money markets are much higher than they have been for quite some time. Though yields look attractive relative to recent history, they’re far from juicy once adjusted for inflation. Assuming a near to intermediate-term inflation rate in the range of 3% doesn’t make today’s bond yields a losing proposition but a slightly positive one while offering the benefit of diversification from equities. A positive aspect of the increase in yields is that it is less expensive to obtain the diversification benefits relative to alternative strategies used when bond rates were 0% and the downside risk of rising rates was outsized.
Given the strains on the financial system and the delicate balance between tipping into recession versus enjoying economic expansion, it pays to stay diversified and balanced in one’s approach. In addition, staying committed to companies with quality balance sheets and cash flows is likely a better long-term strategy than chasing high-valuation equities on a short-term mean reversion rebound.
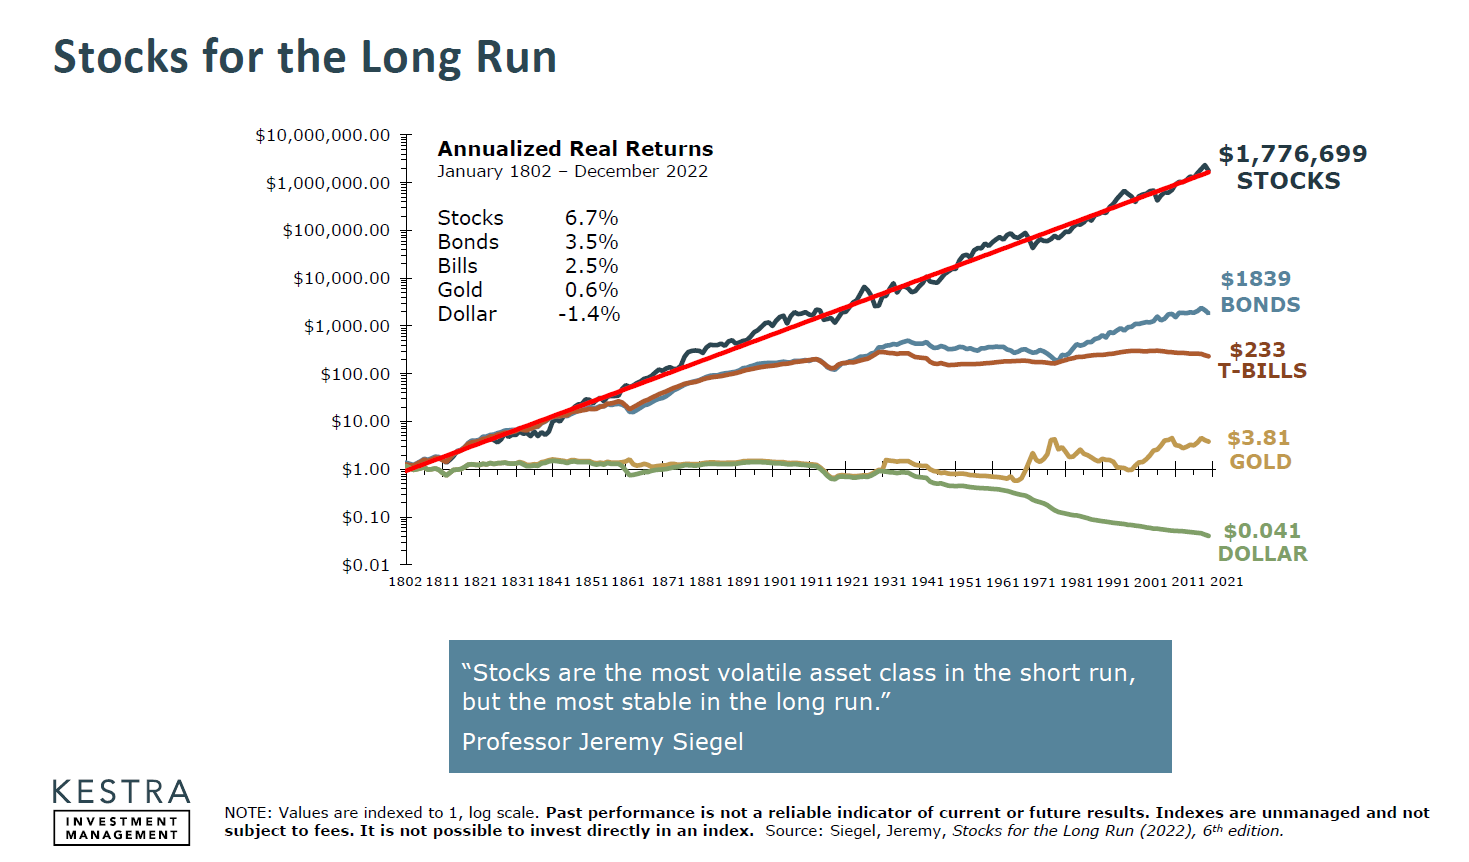
Despite the uneven markets and short-term volatility, stocks and bonds can provide attractive returns to those with a long-term mindset and a broad investment lens. The graph below from the research of Professor Jeremy Siegel is always a great reminder of the historical function of the capital markets and the relationship between asset classes.
Events beyond our control are constantly reshaping the investment markets. It is imperative to have a plan that aligns your portfolio with your goals and risk tolerance, so please talk to us if you’ve any concerns.
Your June month-end portfolio reports have been deposited in your eMoney vault, and we are reaching out to offer review meetings. If you want to schedule a review sooner, please contact us with your availability, or you may self-schedule here.
Many Thanks,
Tim
_______________________________________________________________________________
This material contains an assessment of the market and economic environment at a specific point in time and is not intended to be a forecast of future events or a guarantee of future results. Forward-looking statements are subject to certain risks and uncertainties. Actual results, performance, or achievements may differ materially from those expressed or implied. Information is based on data gathered from what we believe are reliable sources.
The opinions expressed in this commentary are those of the author and may not necessarily reflect those held by Kestra Investment Services, LLC or Kestra Advisory Services, LLC. This is for general information only and is not intended to provide specific investment advice or recommendations for any individual. It is suggested that you consult your financial professional, attorney, or tax advisor with regard to your individual situation. Comments concerning the past performance are not intended to be forward-looking and should not be viewed as an indication of future results.