

It’s been an extremely hot summer in Texas and across the nation for that matter. I hope the heat nor air travel challenges and high gas prices have dampened your summer vacation plans!
From an economic perspective, the month of July offered mixed signals as to the state of the economy. At the end of the month, the second quarter GDP reading was reported as negative. Historically, two consecutive quarters of negative GDP growth have typically been designated a recession. But this period of economic history is anything but typical. Federal Reserve Gov., James Bullard summed up the debate as to when a recession is a recession quite simply. He said, “A recession is in the eye of the beholder.” Whatever we call it, lagging inflation readings are still hot, employment is strong, and corporate earnings and investment is slowing but still growing. Our financial institutions are in good shape relative to past recessions. Pundits and commentators continue to debate whether the bottom is in or whether the July action is just another bear market rally. Our view is that regardless of the short-term view, the drawdown in market indices thus far in 2022 is an opportunity for long-term investors to put long-term money to work.
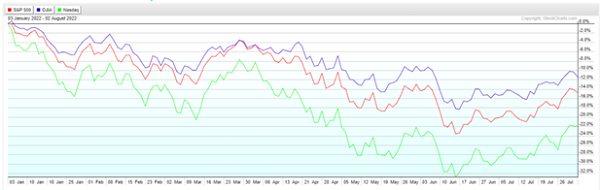
After logging the worst start to the first half of a calendar year since 1970 in July, the major stock indices delivered their best monthly returns since 2020. For July, the Dow (1) rose 6.7%, the S&P 500 (2) 9.1%, and 12.4% on the Nasdaq (3). After an abysmal June, July’s gains returned the indices to approximately where they started a month earlier. The NASDAQ led the rebound finishing approximately 2% higher than where it began in June 2022. The S&P 500 and Dow Jones recovered as well; however, they finished July slightly lower than where they had entered June. Most of July’s returns came in the second half of the month, closing the month with a solid final week. The last week of July was packed with highly anticipated market moving reports, including the initial Q2 GDP print, a busy week for Q2 earnings reports, and a highly anticipated Fed meeting.
 The Federal Reserve concluded its two-day meeting Wednesday, July 27th. As widely expected, the committee unanimously agreed upon a 75-basis point increase. Messaging that accompanied the rate hike conveyed that large, front-end loaded rate hikes are likely finished and that data would drive future hikes. The following day, the Bureau of Economic Analysis reported that GDP shrank 0.9% in Q2, and the personal consumption expenditures price index rose 6.8% in June, the highest level since January 1982. Despite expectations of depressed corporate earnings, second-quarter earnings thus far, with 56% of the S&P 500 companies reporting, have come in better than feared. The market strength through the end of July seemed attributable to three things; 1) the Fed signaled peak tightening, 2) the negative GDP and hot inflation reads were not worse than the market expected, and 3) solid, better than expected, corporate earnings, albeit with increasingly negative guidance. July stock indexes finish strongly, but inflation/recession crosscurrents and geopolitical uncertainty remain.
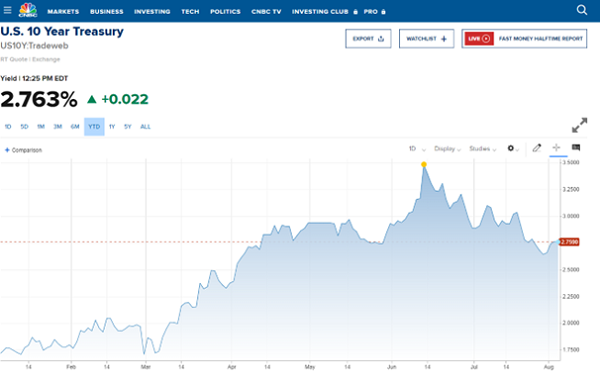
There was a lot of rate movement during July. The 10-year US Treasury yield peaked at 3.48% in mid-June and eased to a high of 3.1% during July closing the month at 2.65%. The yield curve is inverted, with the US two-year treasury closing July at 2.92%, 28 basis points higher than the 10-year. Inverted yield curves are widely considered a harbinger of recessions, though it’s not guaranteed. And given the extreme economic dynamics and central government policies from the pandemic, such indicators and headline readings warrant deeper analysis instead of taking them at face value.
Higher mortgage rates have taken their toll on the hot housing sector. Leading home builder indicators and home prices are finally beginning to cool. The expectation of recession and lower yields on treasury bonds have eased mortgage rates a bit. But the combination of higher prices and elevated mortgage rates relative to the past three years has increased the cost of home ownership.
The flip side of higher rates is that money markets and other short-term investments are paying higher yields than we’ve seen for the past three years. We evaluated the cash holdings in our client accounts for opportunities to capture higher yields. If you have idle cash, you might consider your options for taking advantage of these higher short-term rates. Your unique circumstances will determine the best money market for you – how much you have available to invest, your tax bracket, and your risk profile. We can match you to an appropriate money market or another alternative to bank deposit products. Upon comparison, you will likely find that major national banks still offer low rates on CDs in interest-bearing checking and savings accounts. It appears that banks move faster to raise the rates they charge for loans than they do to raise the rates they pay on deposits.
Geopolitical risks abound from Ukraine to Taiwan. News of Russia’s hold on the supply of natural gas to Germany and much of Europe via the Nord Stream II pipeline may make for a cold winter and challenge the region’s production capacity.
As the Federal Reserve takes measures to dampen inflation and geopolitical events evolve, we will stay focused on what we can control and remain committed to investment strategies informed by your financial plan and portfolios that are well-diversified, cost-effective, and tax conscious. We will stay true to our long-term, strategic asset allocation principles and belief that equities will outperform bonds over the long run.
Your July portfolio reports and your individual account statements have been posted to your eMoney vault. If you want to discuss our investment viewpoint and how it impacts your portfolio, we look forward to the opportunity to discuss the specifics of your portfolio with you.
Thank you for your continued trust!
Tim
_____________________________________________________________________________________
1. DOW – The Dow Jones Industrial Average (Dow) is an unmanaged group of securities considered to be representative of the stock market in general.
2. S&P 500 Index – The Standard & Poor’s 500 (S&P 500) is an unmanaged group of securities considered to be representative of the stock market in general.
3. NADAQ – The NASDAQ is an unmanaged group of securities considered to be representative of the stock market in general.
This material contains an assessment of the market and economic environment at a specific point in time and is not intended to be a forecast of future events, or a guarantee of future results. Forward-looking statements are subject to certain risks and uncertainties. Actual results, performance, or achievements may differ materially from those expressed or implied. Information is based on data gathered from what we believe are reliable sources.
The opinions expressed in this commentary are those of the author and may not necessarily reflect those held by Kestra Investment Services, LLC or Kestra Advisory Services, LLC. This is for general information only and is not intended to provide specific investment advice or recommendations for any individual. It is suggested that you consult your financial professional, attorney, or tax advisor with regard to your individual situation. Comments concerning the past performance are not intended to be forward-looking and should not be viewed as an indication of future results.